Data Grids
Tabular lists of entities, displayed in data grids, comprise a major part of the CIViC user interface. This section details the various data grids that users will encounter while using CIViC.
Evidence Grid
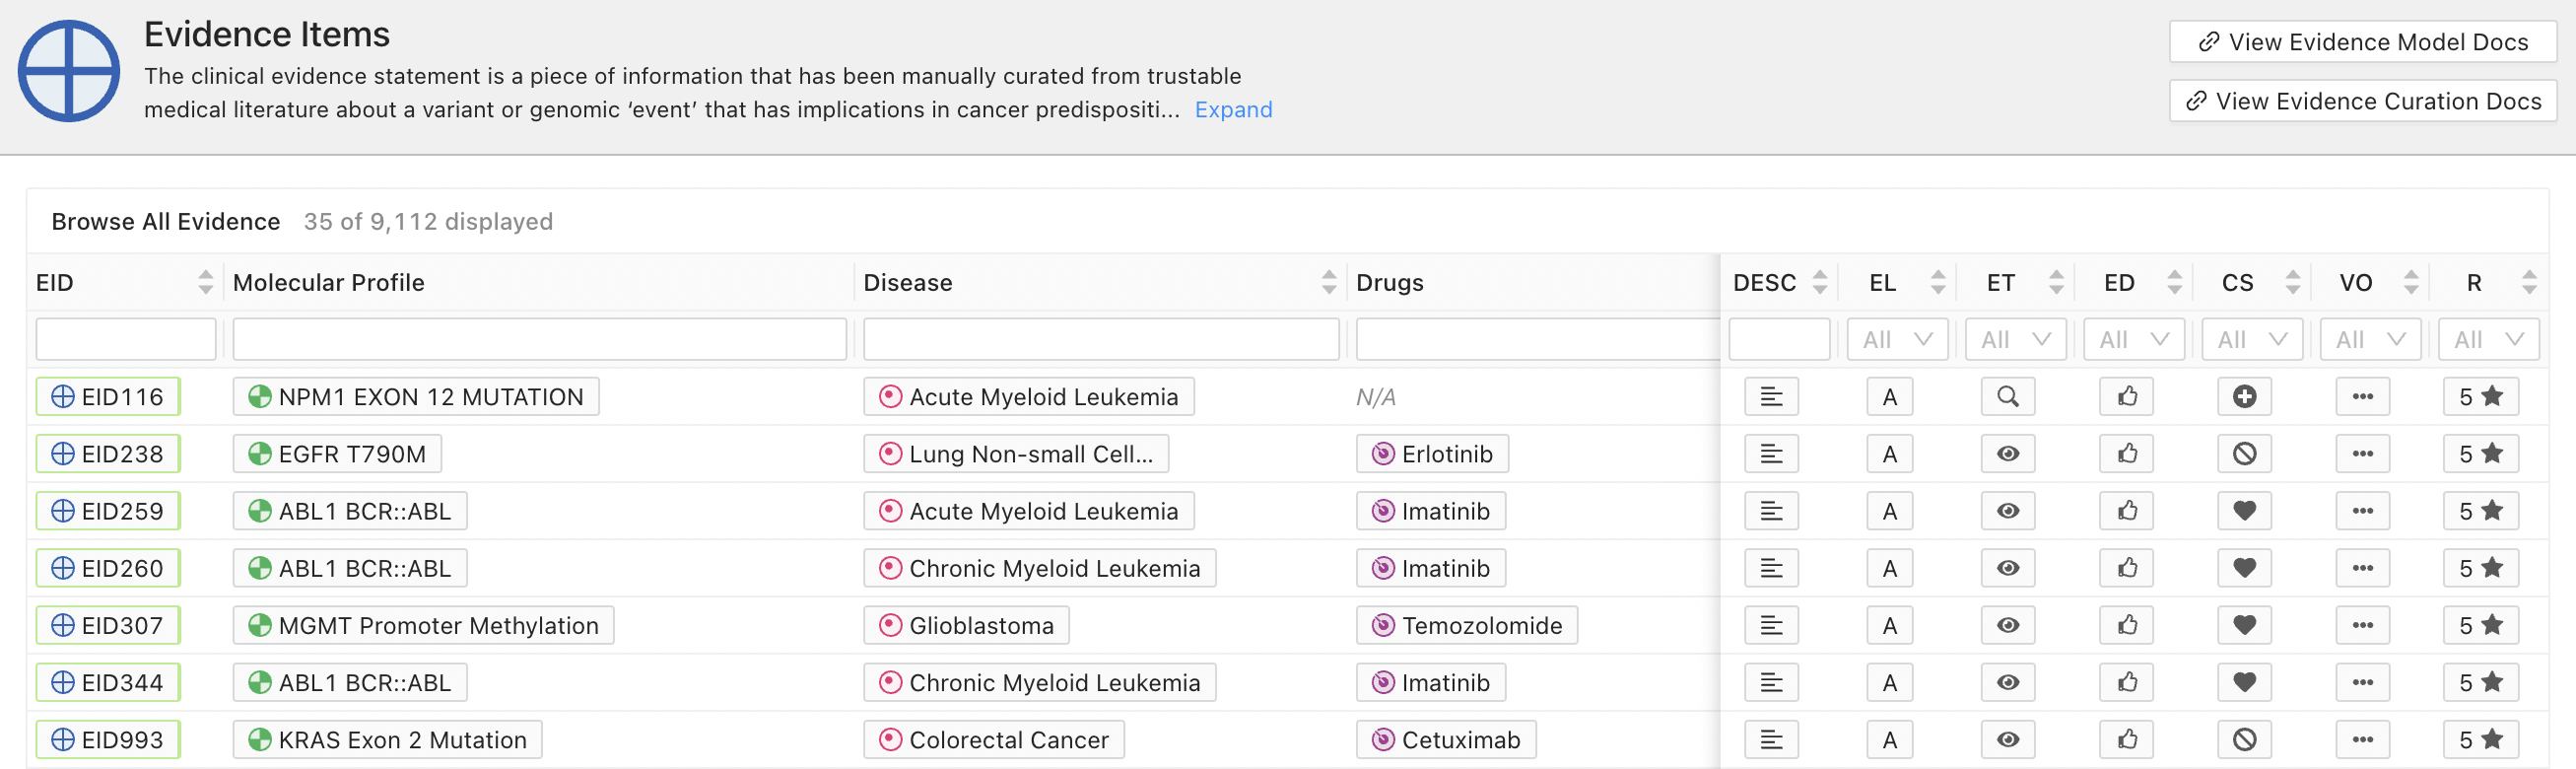
The evidence grid displays lists of evidence items, and provides various methods to filter subsets of evidence items of interest to the user.
Column |
Description |
|---|---|
EID |
Evidence ID |
Molecular Profile |
Molecular Profile associated with the Evidence |
Disease |
Disease associated with the Evidence |
Therapies |
Therapies (e.g. drugs) associated with the Evidence |
IT |
Therapy Interaction Type |
DESC |
Evidence description |
EL |
Evidence Level |
ET |
Evidence type |
ED |
Evidence direction |
S |
Significance |
VO |
Variant origin |
R |
Evidence Rating |
Assertion Grid
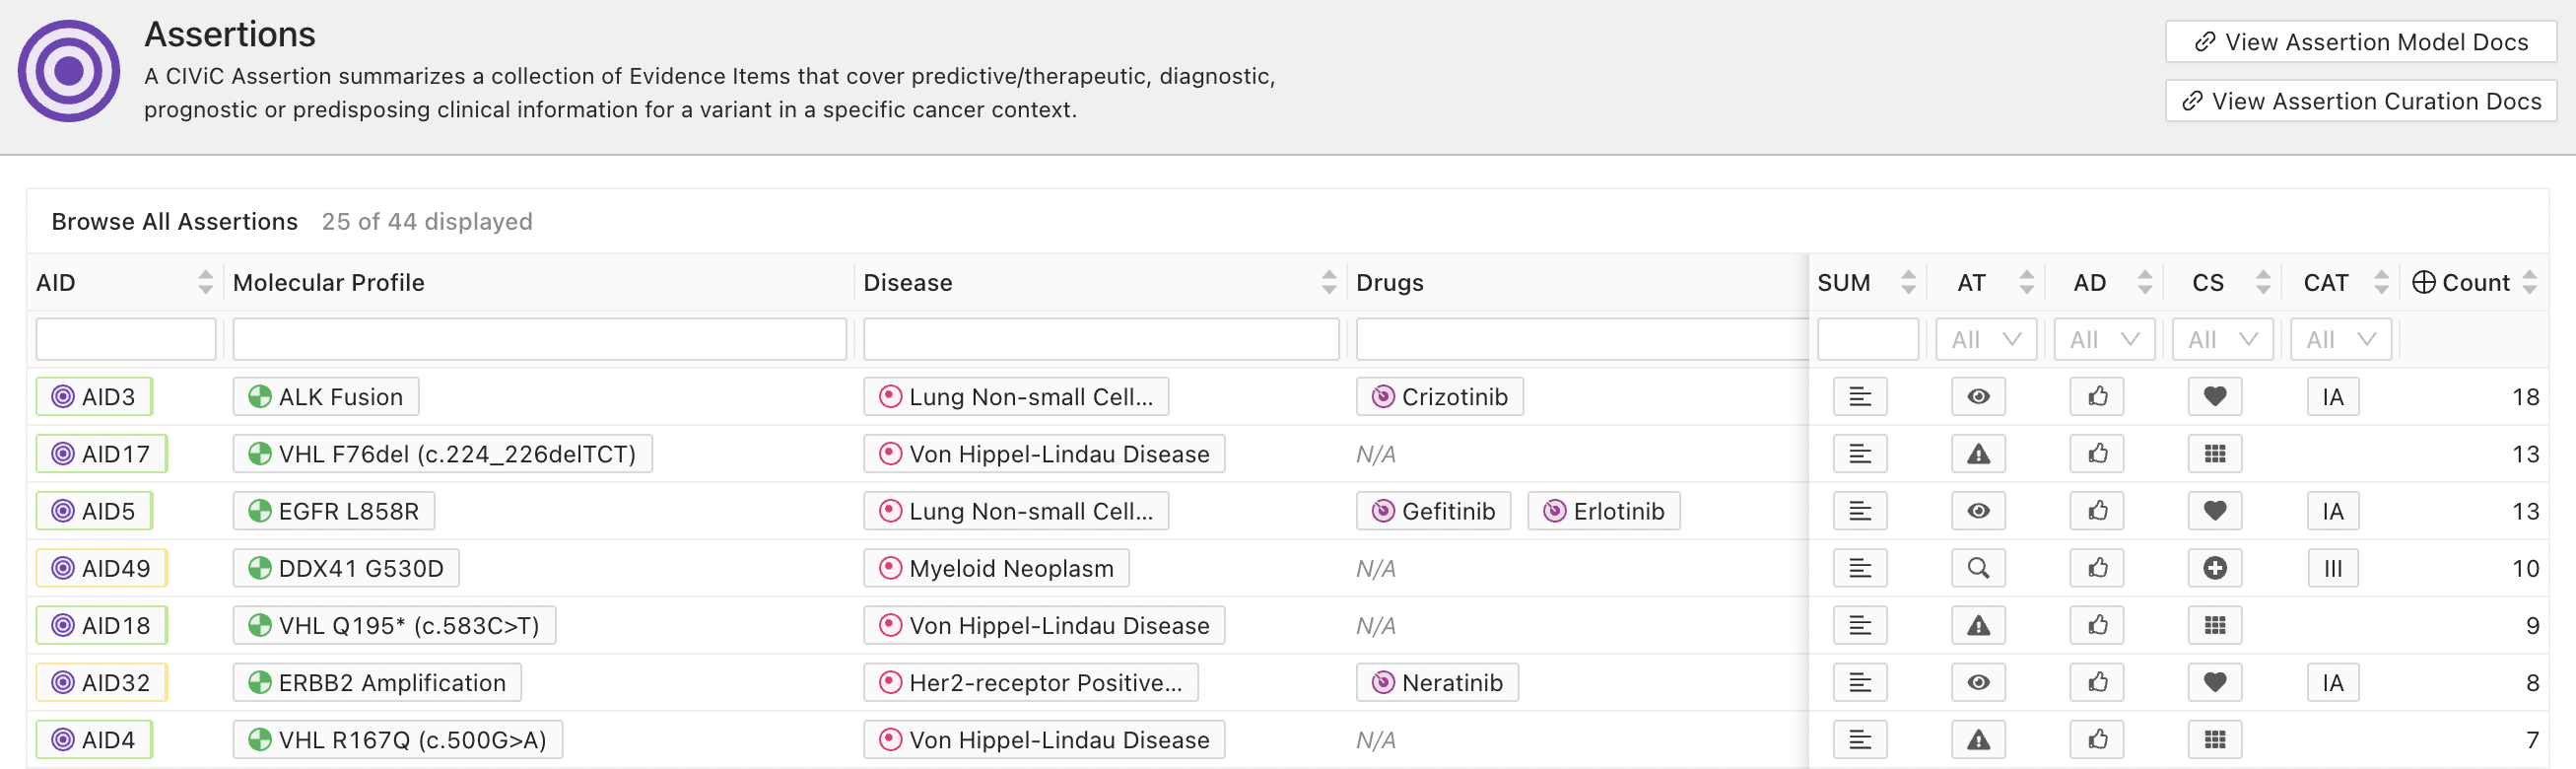
Assertion grids display lists of assertion items, and provide various methods to filter subsets of assertions of interest to the user.
Column |
Description |
|---|---|
AID |
Assertion ID |
Molecular Profile |
Molecular Profile associated with the Assertion |
Disease |
Disease |
Therapies |
Therapies associated with the item |
IT |
Therapy Interaction Type |
SUM |
Assertion summary |
AT |
Assertion type |
AD |
Assertion direction |
S |
Significance |
CAT |
AMP/ASCO/CAT Category |
Evidence Count |
Count of evidence items associated with Assertion |
Activity Feed
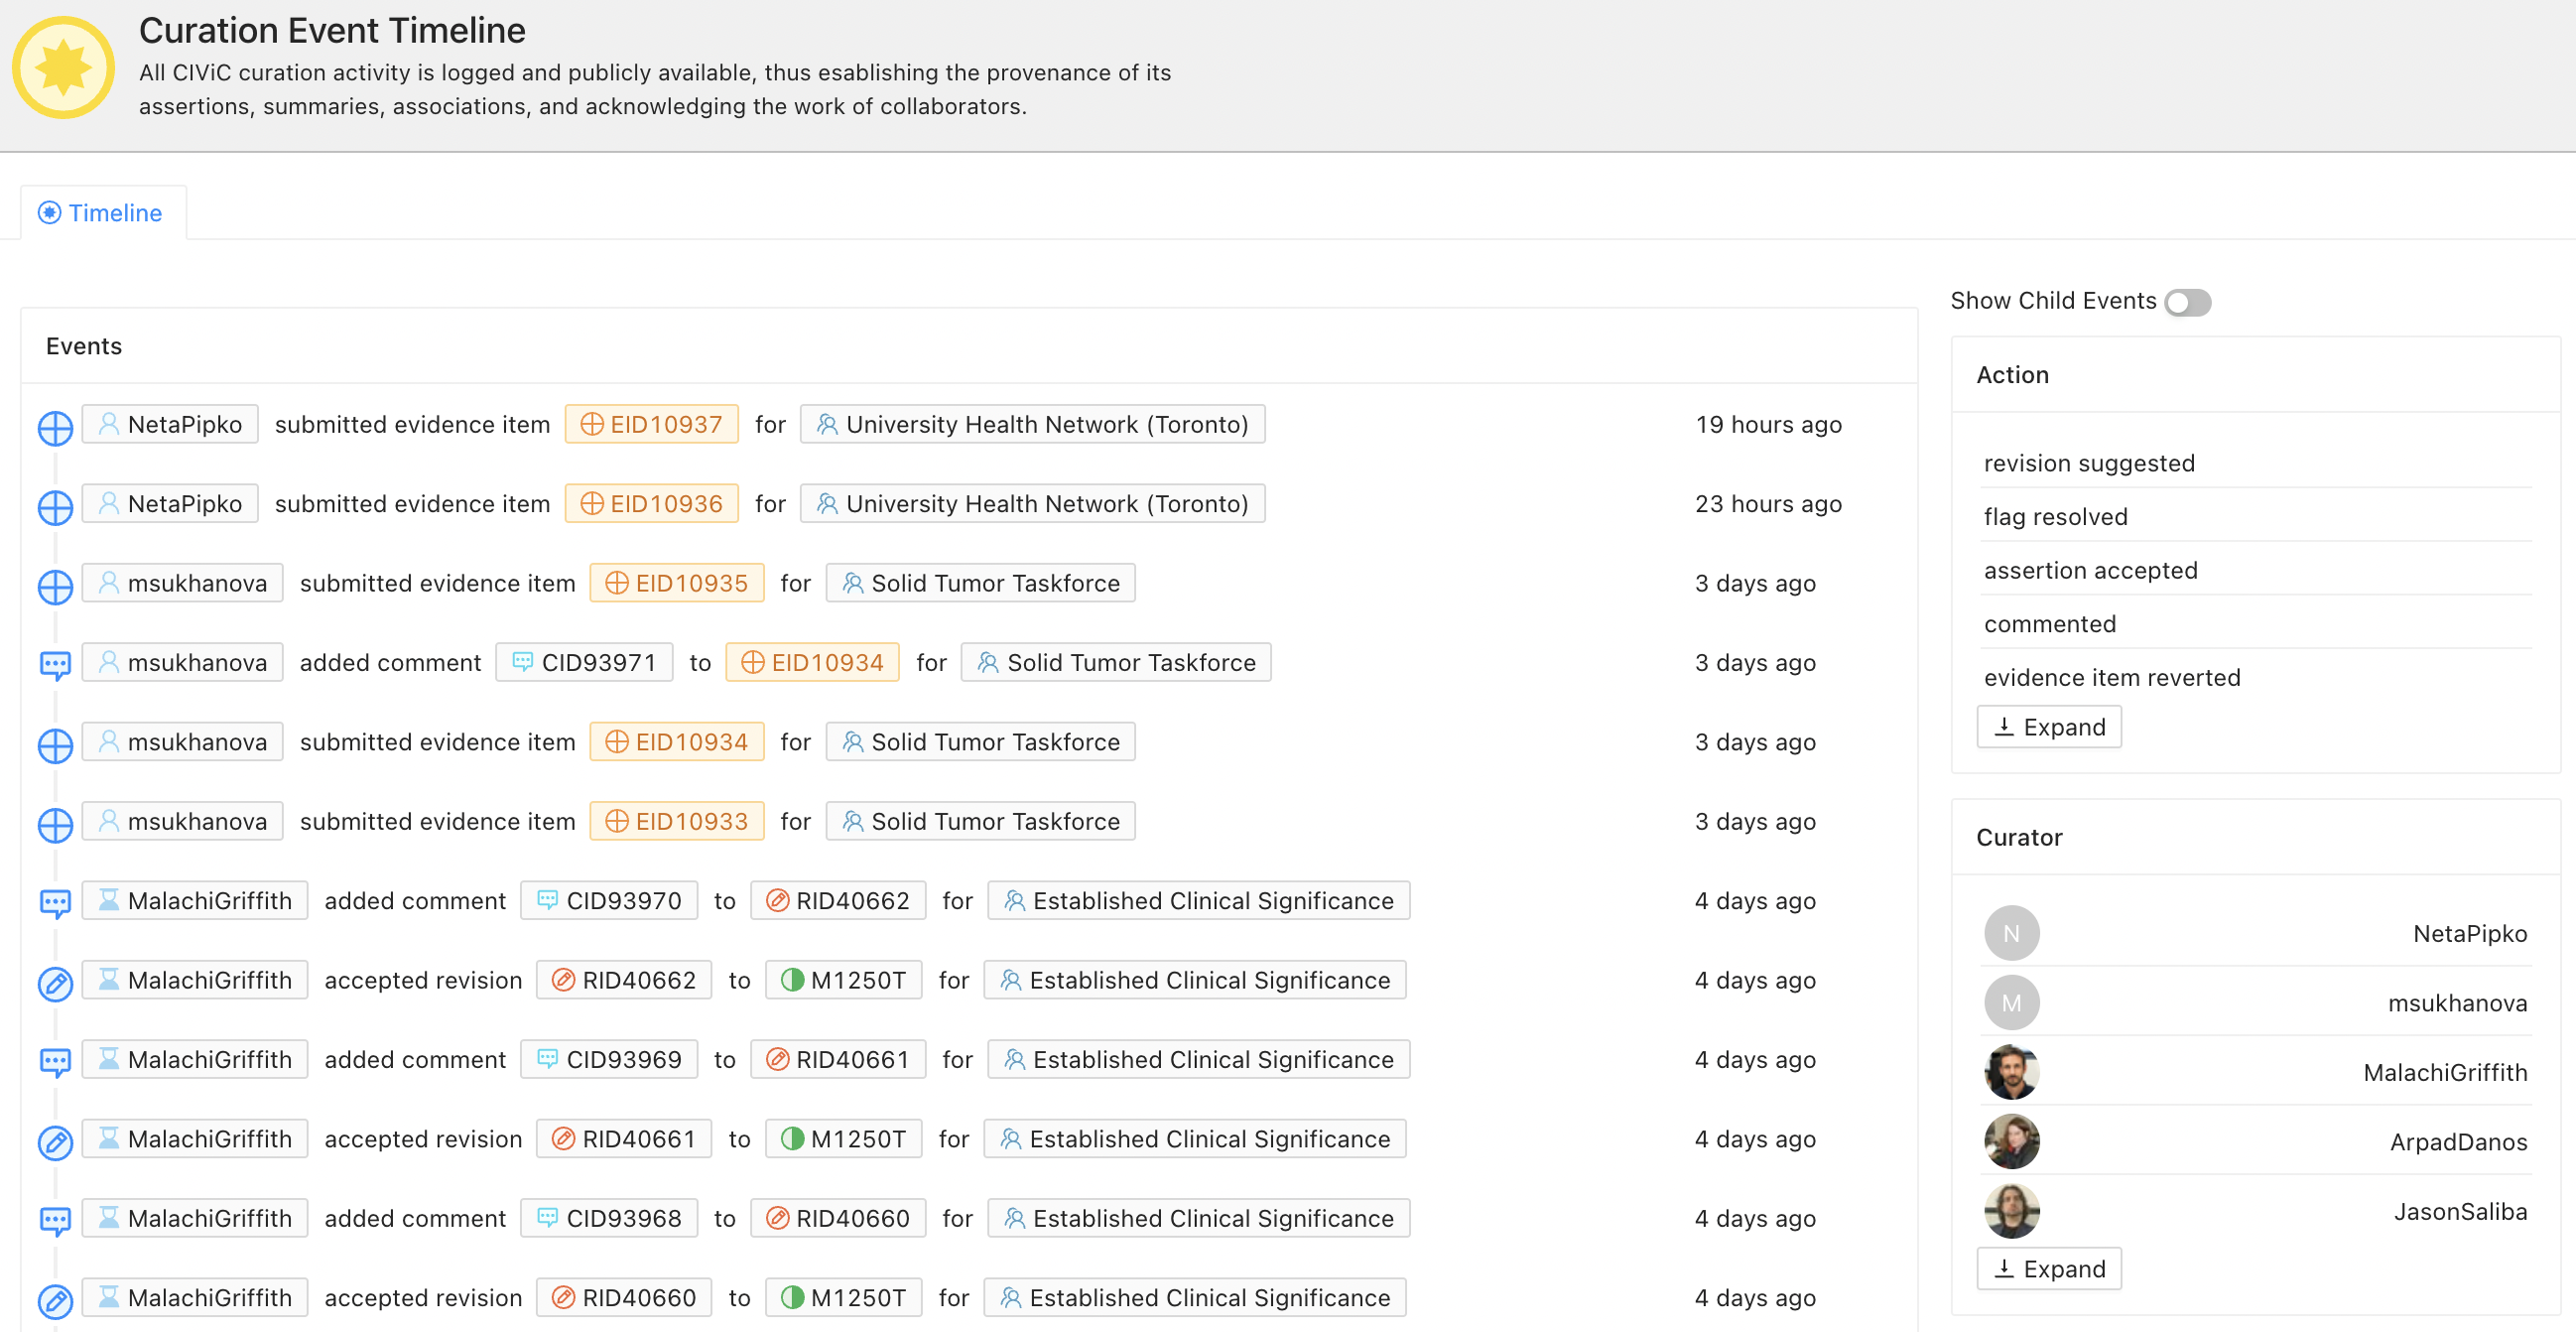
The Activity Feed (Curation Event Timeline) displays recent curation activity. Each event includes the responsible curator/editor, action (comment, addition, revision, etc), affected entities (gene, molecular profile, evidence, etc), organization, and timestamp. The displayed events can be optionally configured to show Child Events and filtered to specific actions types, curators, or organizations.
Other Data Grids
CIViC also provides data grids for Genes, Molecular Profiles, Variants, Variant Groups, Clinical Trials, Diseases, Therapies, Phenotypes, Variant Types, and Sources. These grids are relatively self-explanatory.